Predicting Baseball Wins with WAR
This is a lot of debate about the usefulness of the comprehensive baseball statistic, WAR — Wins Above Replacement. I don’t think that WAR is the end all statistic, but it is a useful tool. Why? Because it can describe relatively accurately how a player contributes to a team. It also can help fans understand the real impact of one player. I might have to refer people here once people start clamoring that a single player will change the direction of a team at the trade deadline.
If anyone wants a primer on the details of what goes into the WAR stat, check out baseball-reference.com’s comparison between systems. Basically, WAR is the number of statistical wins the player is responsible for above a replacement player. In theory the replacement is the mediocre AAA player that is not a prospect. That statistic is the middle estimate of the impact the player will have, a player can be ‘responsible’ for more wins than their WAR number, but also drastically less. Think of WAR as the average wins he’s responsible for.
For probably over a year, I’ve wanted to see if WAR actually can predict the number of wins a team will have. I forget my original methods of trying to determine this, but this time round, I used FanGraphs’ WAR numbers for both pitching and batting from the last decade of season for all 30 teams. That’s 300 data points. After assembling the data and then running it through a basic linear regression, I was quite happy with what I saw. I’ve heard that if you add 48 to the team’s WAR number that you will get their total wins, and this can be seen mathematically by looking at real data.

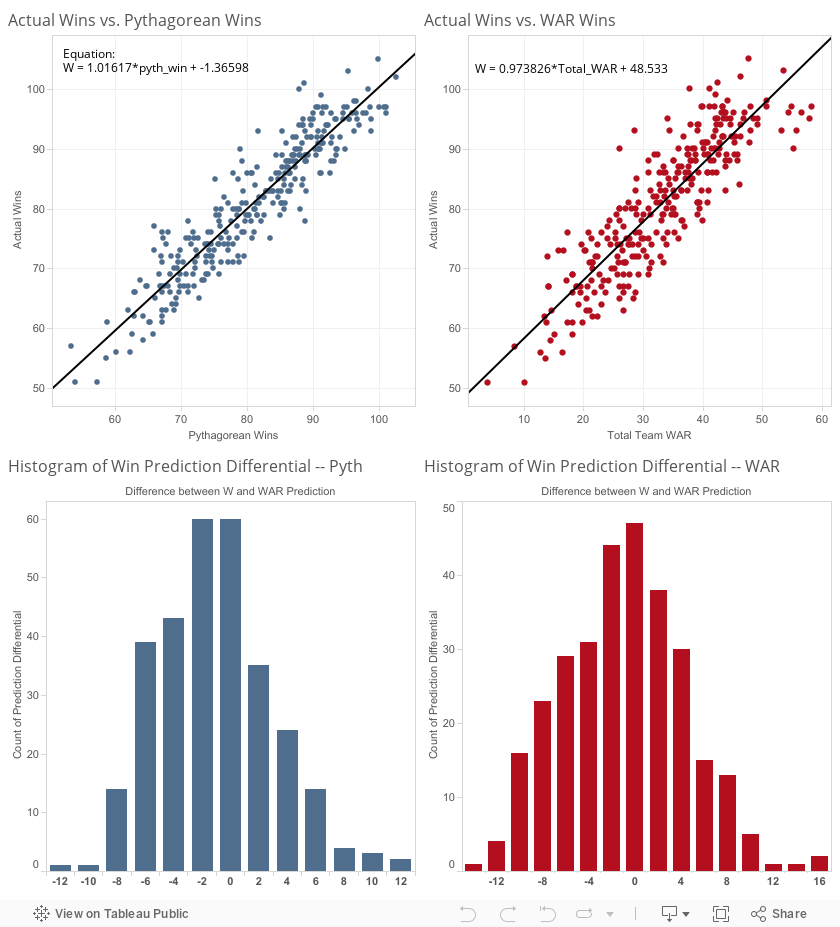
I’ve graphed the actual wins to WAR and actual wins to the Pythagorean predicted wins for comparison. [Pythagorean wins performed better.] The linear regression for the WAR comparison actually turns out to be incredibly powerful. The regression coefficient is almost exactly equal to one meaning that each unit increase in WAR means an equal increase in wins. The y-intercept is +48.5, which means for the last decade the number of theoretical replacement wins has been just about 48. This should make sense, since the calculation of WAR is calibrated to a 48 win replacement level. The actual implementation of WAR works really well to predict teams wins. Unfortunately, this model will have a 95% prediction interval of 20 wins. That seems like a lot but, it shows how much luck has to do with a baseball season.
Pythagorean wins are typically used to show how lucky the team has been this year or not. This is actually a slightly better predictor of a teams’ success than WAR. There is less variance since run differential is just one step away from wins. You can see from the histograms that the spread on Pythagorean wins is less than with WAR. This can also be seen in the r-square for the linear regression. Pythagorean wins linear model has an r-square of .87 while the WAR model has an r-square of .77. This ultimately means that 87% and 77% of the variance is explained by the model indicating that the Pythagorean wins is slightly more accurate. The trade off is that WAR can give you player-level detail while run differential is only team-specific.
As always, let’s look at what the Pirates did.

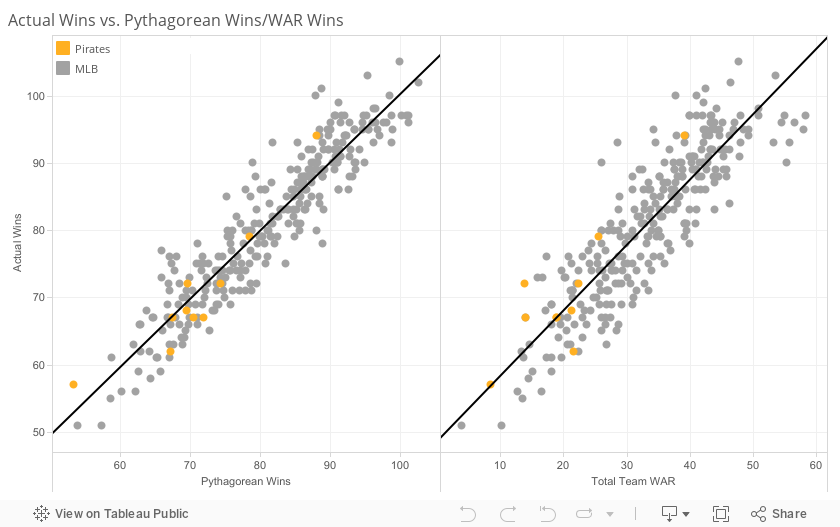
A theme I always harp on was that the 2013 Pirates were good and really lucky. This can be seen by the data point for 2013 falling above the linear regression trend line. If you were wondering 2012 and 2011 (the two ‘collapse’ years) also fall above this line. I don’t know if this is the best way to measure a collapse, but the in-season stats did indicate regression during all three seasons 2011-2013.