#SeanTrek GeoTracks 2012

You might remember #SeanTrek — the 46 day, 12,000 mile, 34 state excursion I took back at the very end of 2012. I didn’t know what I how I was going to use this at the time, but I geotagged just about everything I did on the trip. I checked-in to every place on Foursquare and obtained over 700 points in Portland and San Francisco, which is insane because I checked in just about everything I did or place I went. On top of Foursquare I geotagged every tweet I sent and picture I took. This resulted in me now having thousands of data points of both timestamps and location data.
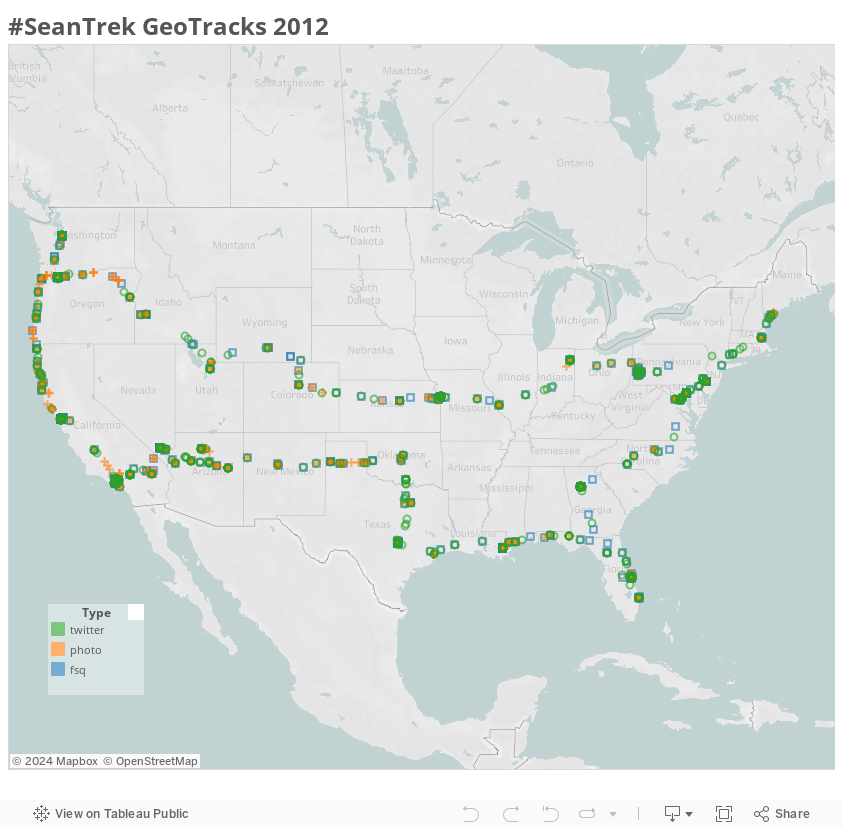
The above map is what happens when you put all of them together. It outlines my entire trip! The more dense the marks the more I was in one place longer exploring it. Sparse points means I was driving a lot. You’ll find a lot of marks around Pittsburgh, Portland, SF, LA, Austin, and New Orleans, because I spent the most time there and didn’t drive much in most of those cities. I have a rather nice record of a long trip that didn’t require me to painstakingly record exactly what I did.
This map only has geotag data and the type of media. I’m hoping to use the geotag data and the timestamp to get an average speed between the two points. I also want to geocode some tweets or photos that were not geocoded in 2012 by interpolating using the timestamp now.
Once I properly extract the data from the tweets, I can have hashtags or mentions searchable by frequency and location. I used #SeanTrek a lot more than any other hashtag on the trip. Though curiously enough the first tweet mentioning #SeanTrek is not geotagged. (technical glitch) Hopefully, I’ll get some more things mapped out in the future.